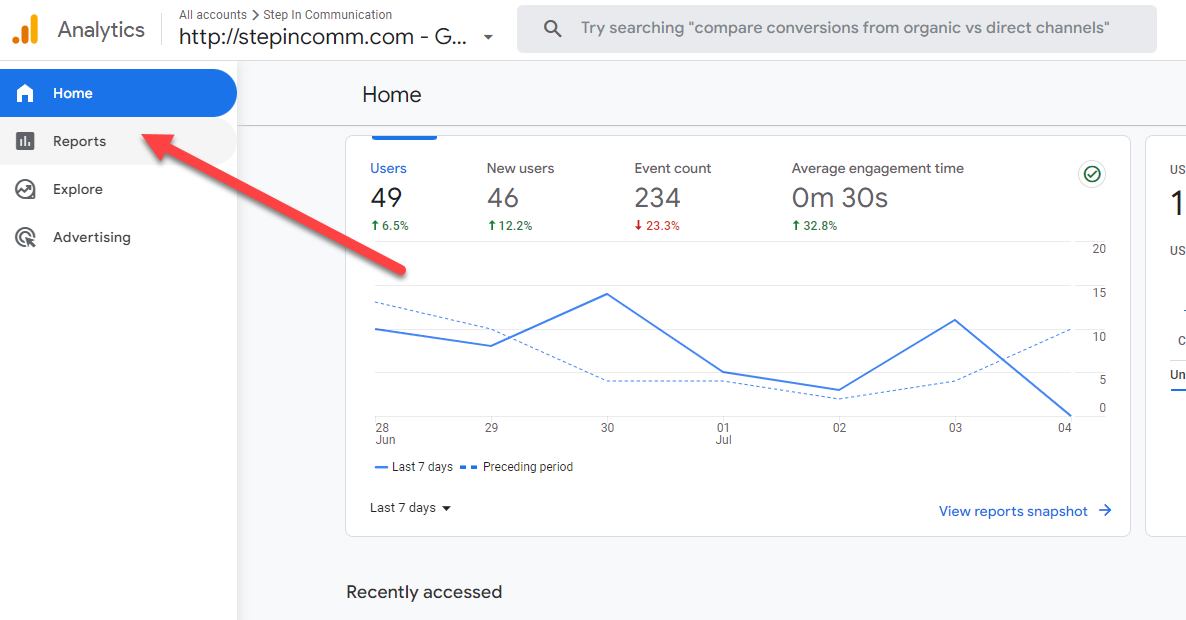
It’s time to learn more about the new reports you can access in Google Analytics 4. If you’re just getting your head wrapped around all the differences in the new analytics, you are not alone.
If you try to absorb it all in one sitting, it’s too much for a busy communicator. So this post is about the three reports you will want to be able to find and use right away. The rest of the mind-blowing data can come later– like conversions, events and other good stuff!
What Three Reports Should You be Looking at Right Now?
The Three Reports and how you can use them
- Acquisition→ Traffic Acquisition
- Engagement→ Pages and Screens
- Engagement → Landing Pages
Let’s look at what you can see immediately with each one.
Traffic Acquisition Report
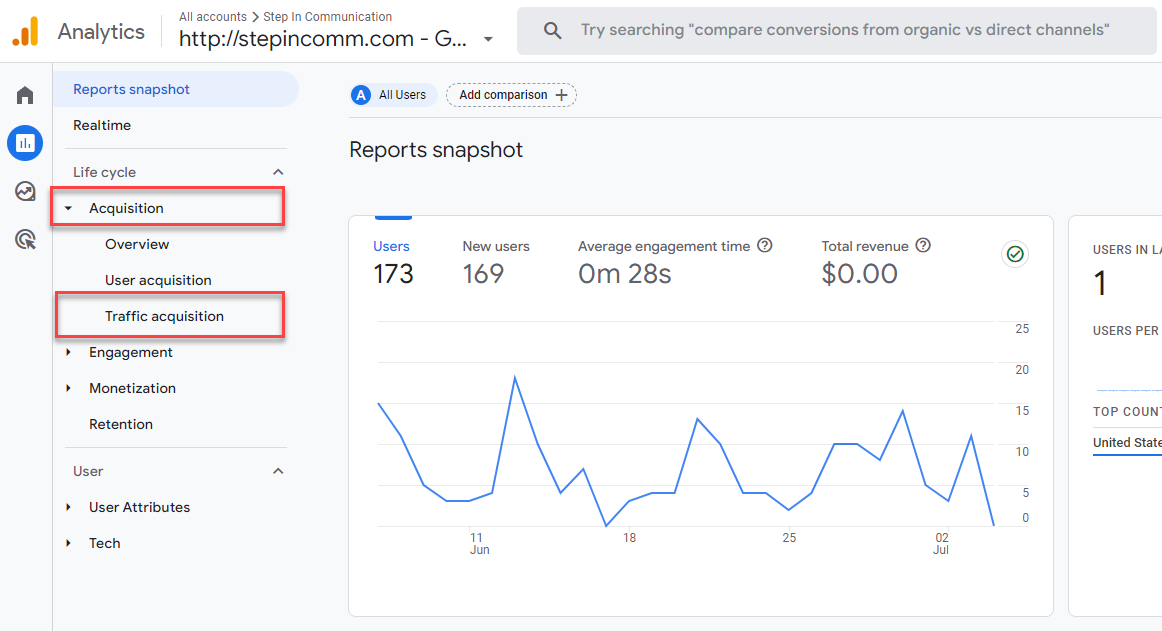
If you’re just getting started with GA4 and haven’t yet set up any customizations, you will see four categories in the rollup. The categories are:
Direct: people who typed your address into a search bar and got to your website directly
Organic Search: people who did a Google Search and you were a result
Organic Social: People who came to your site from a social post
Referral: people who clicked on a link that someone else shared about you.
Why Should You Look at this Report?
If someone wrote a news story about you, then your direct and referral traffic might reflect this. If you’ve been publishing content on your website, then the organic search results might be the result of that.
If you’ve been posting a lot on your connected social platforms with links to your site, then you can see the results of that.
When you look at this section of your Google Analytics 4, you should be able to have an idea of what recent activities are driving traffic to your site. (later, when you’ve configured things some more, you’ll KNOW and will be able to PROVE it).
Engagement: Pages and Screens Report
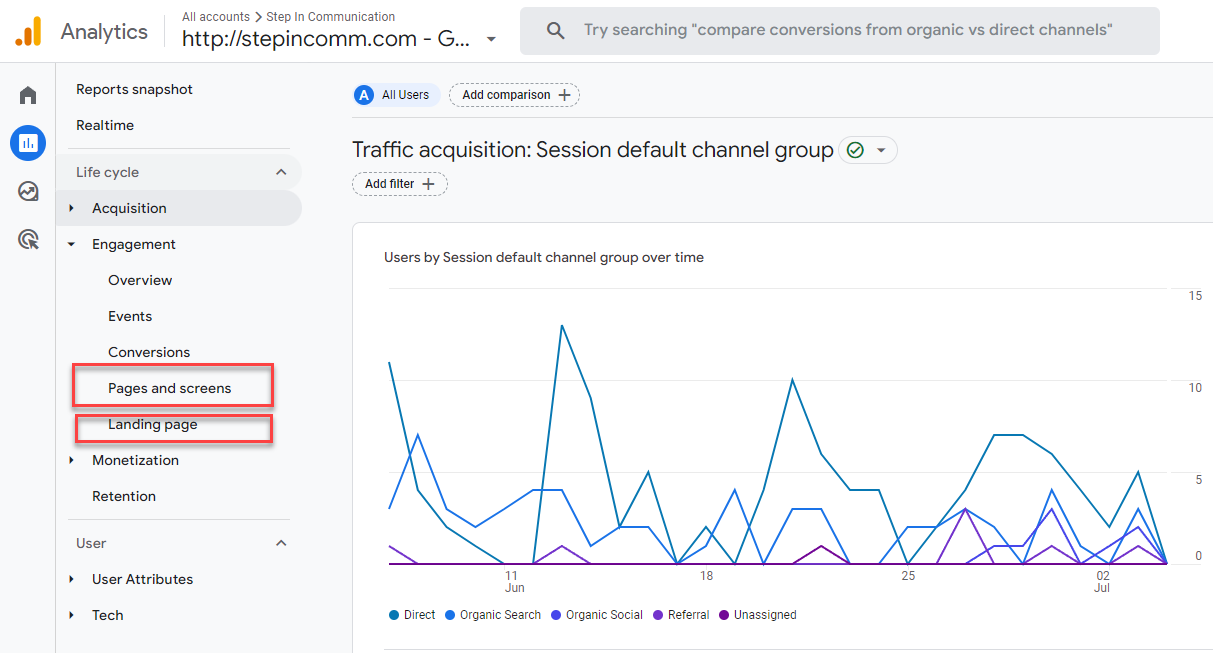
When you navigate to the Engagement: Pages and Screens Report, the default screen will show you what pages and posts on your website are attracting the most traffic. The report defaults to the top 10, but you can change the “Rows per page” setting to 25, 50 or more.
Why Should You Look at this Report?
Did you publish a newsletter and point to content on your website? This gives you an idea of that impact?
Did you publish and then publicize a new blog post, case study, portfolio item or more? You should see how many people visited that post and how much time they spent on it.
Engagement: Landing Pages
This report looks similar to the Pages and Screens Report, in that it’s a chart, divided into rows. YOu can also change the “Rows per Page” default setting here too.
Why Should You Look at This Report?
I use this report to see if a recently published blog post is rising to the top or getting traction within the first week. My goal is that each new post goes to the top three landing pages of my site while I’m promoting it.
While the two Engagement reports – pages and screens and landing pages look similar, the data contained in each is usually different, which is why I like to check out both when I’m reviewing analytics.
Next month we’re going to look at events and conversions and how you can use these to see what’s happening on your website.